Why a clean eye diagram does not finish interconnect qualification
An eye diagram can look reassuring long before a link has demonstrated the error performance its application needs. At 1.6T Ethernet speeds, that gap matters: a waveform measurement, a receiver test and a long run of error statistics answer different questions.
The eye shows how signal levels and transitions behave at a measurement point. It can expose noise, timing variation and restricted margins. But it does not, by itself, establish how often the receiving system will make the wrong decision over an extended operating period.
PAM4 adds another distinction. Each symbol carries two bits, so symbol errors and bit errors are different quantities. Their relationship depends on which symbol was mistaken for which, rather than a universal conversion factor. [Source 1]
The time hidden inside a BER claim
Bit error ratio is the number of erroneous bits divided by the number observed. Reporting zero errors therefore needs an observation interval.
Consider an illustrative test at 212.5Gbit/s. To demonstrate a bit error ratio below 10⁻¹⁵ with approximately 95% confidence, assuming independent errors and a stationary error process, a zero-error test requires about 3 × 10¹⁵ observed bits.
That takes approximately 3.9 hours on one continuously measured lane.
This is a statistical illustration, not a prescribed Ethernet qualification procedure. It shows why a brief error-free demonstration cannot support an arbitrarily small BER claim. Different confidence levels change the required duration; burst errors and changing operating conditions can also undermine the simple independent-error assumption. Keysight’s explanation of BER measurement makes the observation period central to interpreting the result. [Source 2]
FEC changes what must be measured
Forward error correction allows a link to recover data despite some transmission errors. That creates several useful measurements: errors before correction, errors remaining afterwards and the distribution of errors presented to the decoder.
Two links can produce similar average pre-FEC error ratios while placing different demands on that decoder. Errors concentrated within particular codewords can be harder to correct than the same total spread more evenly.
A post-FEC result alone can consequently hide how close the link is operating to its correction limit. Conversely, an uncorrected error count without the corresponding FEC behaviour does not describe the delivered service.
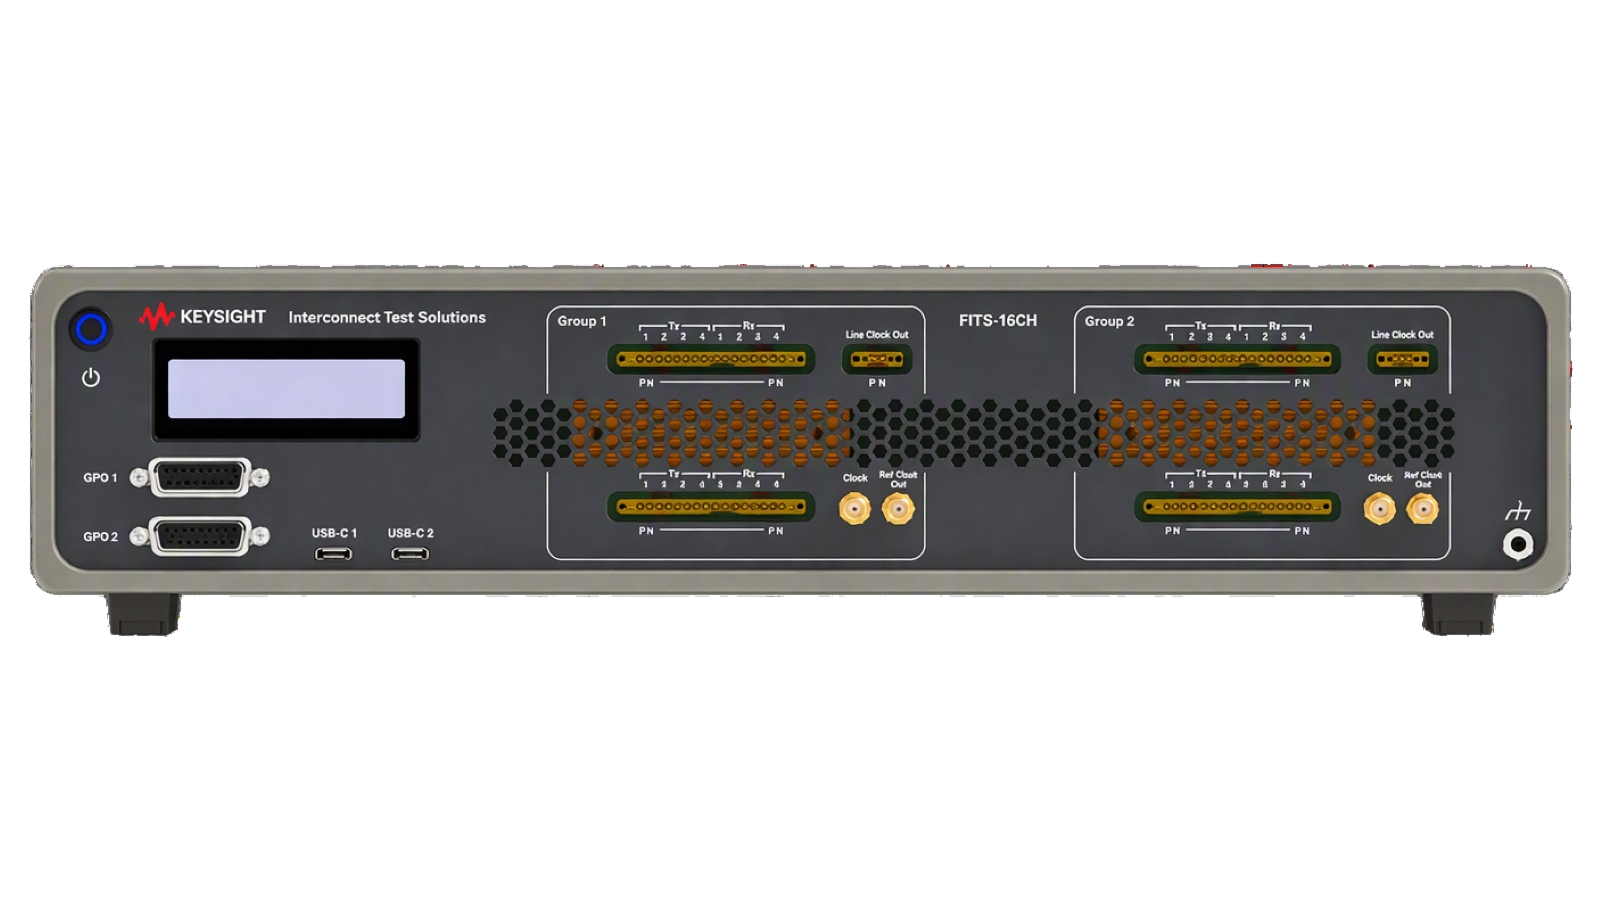
Keysight’s expanded FITS system illustrates the move towards measuring these quantities together. It supports 16 transmit and receive channels at lane rates up to 212.5Gbit/s, with options covering pre- and post-FEC BER, frame loss and FEC symbol-error distributions. These are assembly-level measurements for copper and optical interconnects, alongside physical-layer characterisation. [Source 3]
A useful qualification record therefore identifies the measurement point, lane rate, equalisation settings, FEC configuration, observed bits and test conditions. Without those details, two apparently identical “error-free” results may describe very different tests.